Since our launch on May 1, Silea has delivered a remarkable annualized return of 56.2% with a Sharpe ratio of 3.7. These updated figures reflect Silea’s outstanding performance based on deployed capital, rather than the full, unutilized allocation. Our performance since May 1 is illustrated in the chart below.
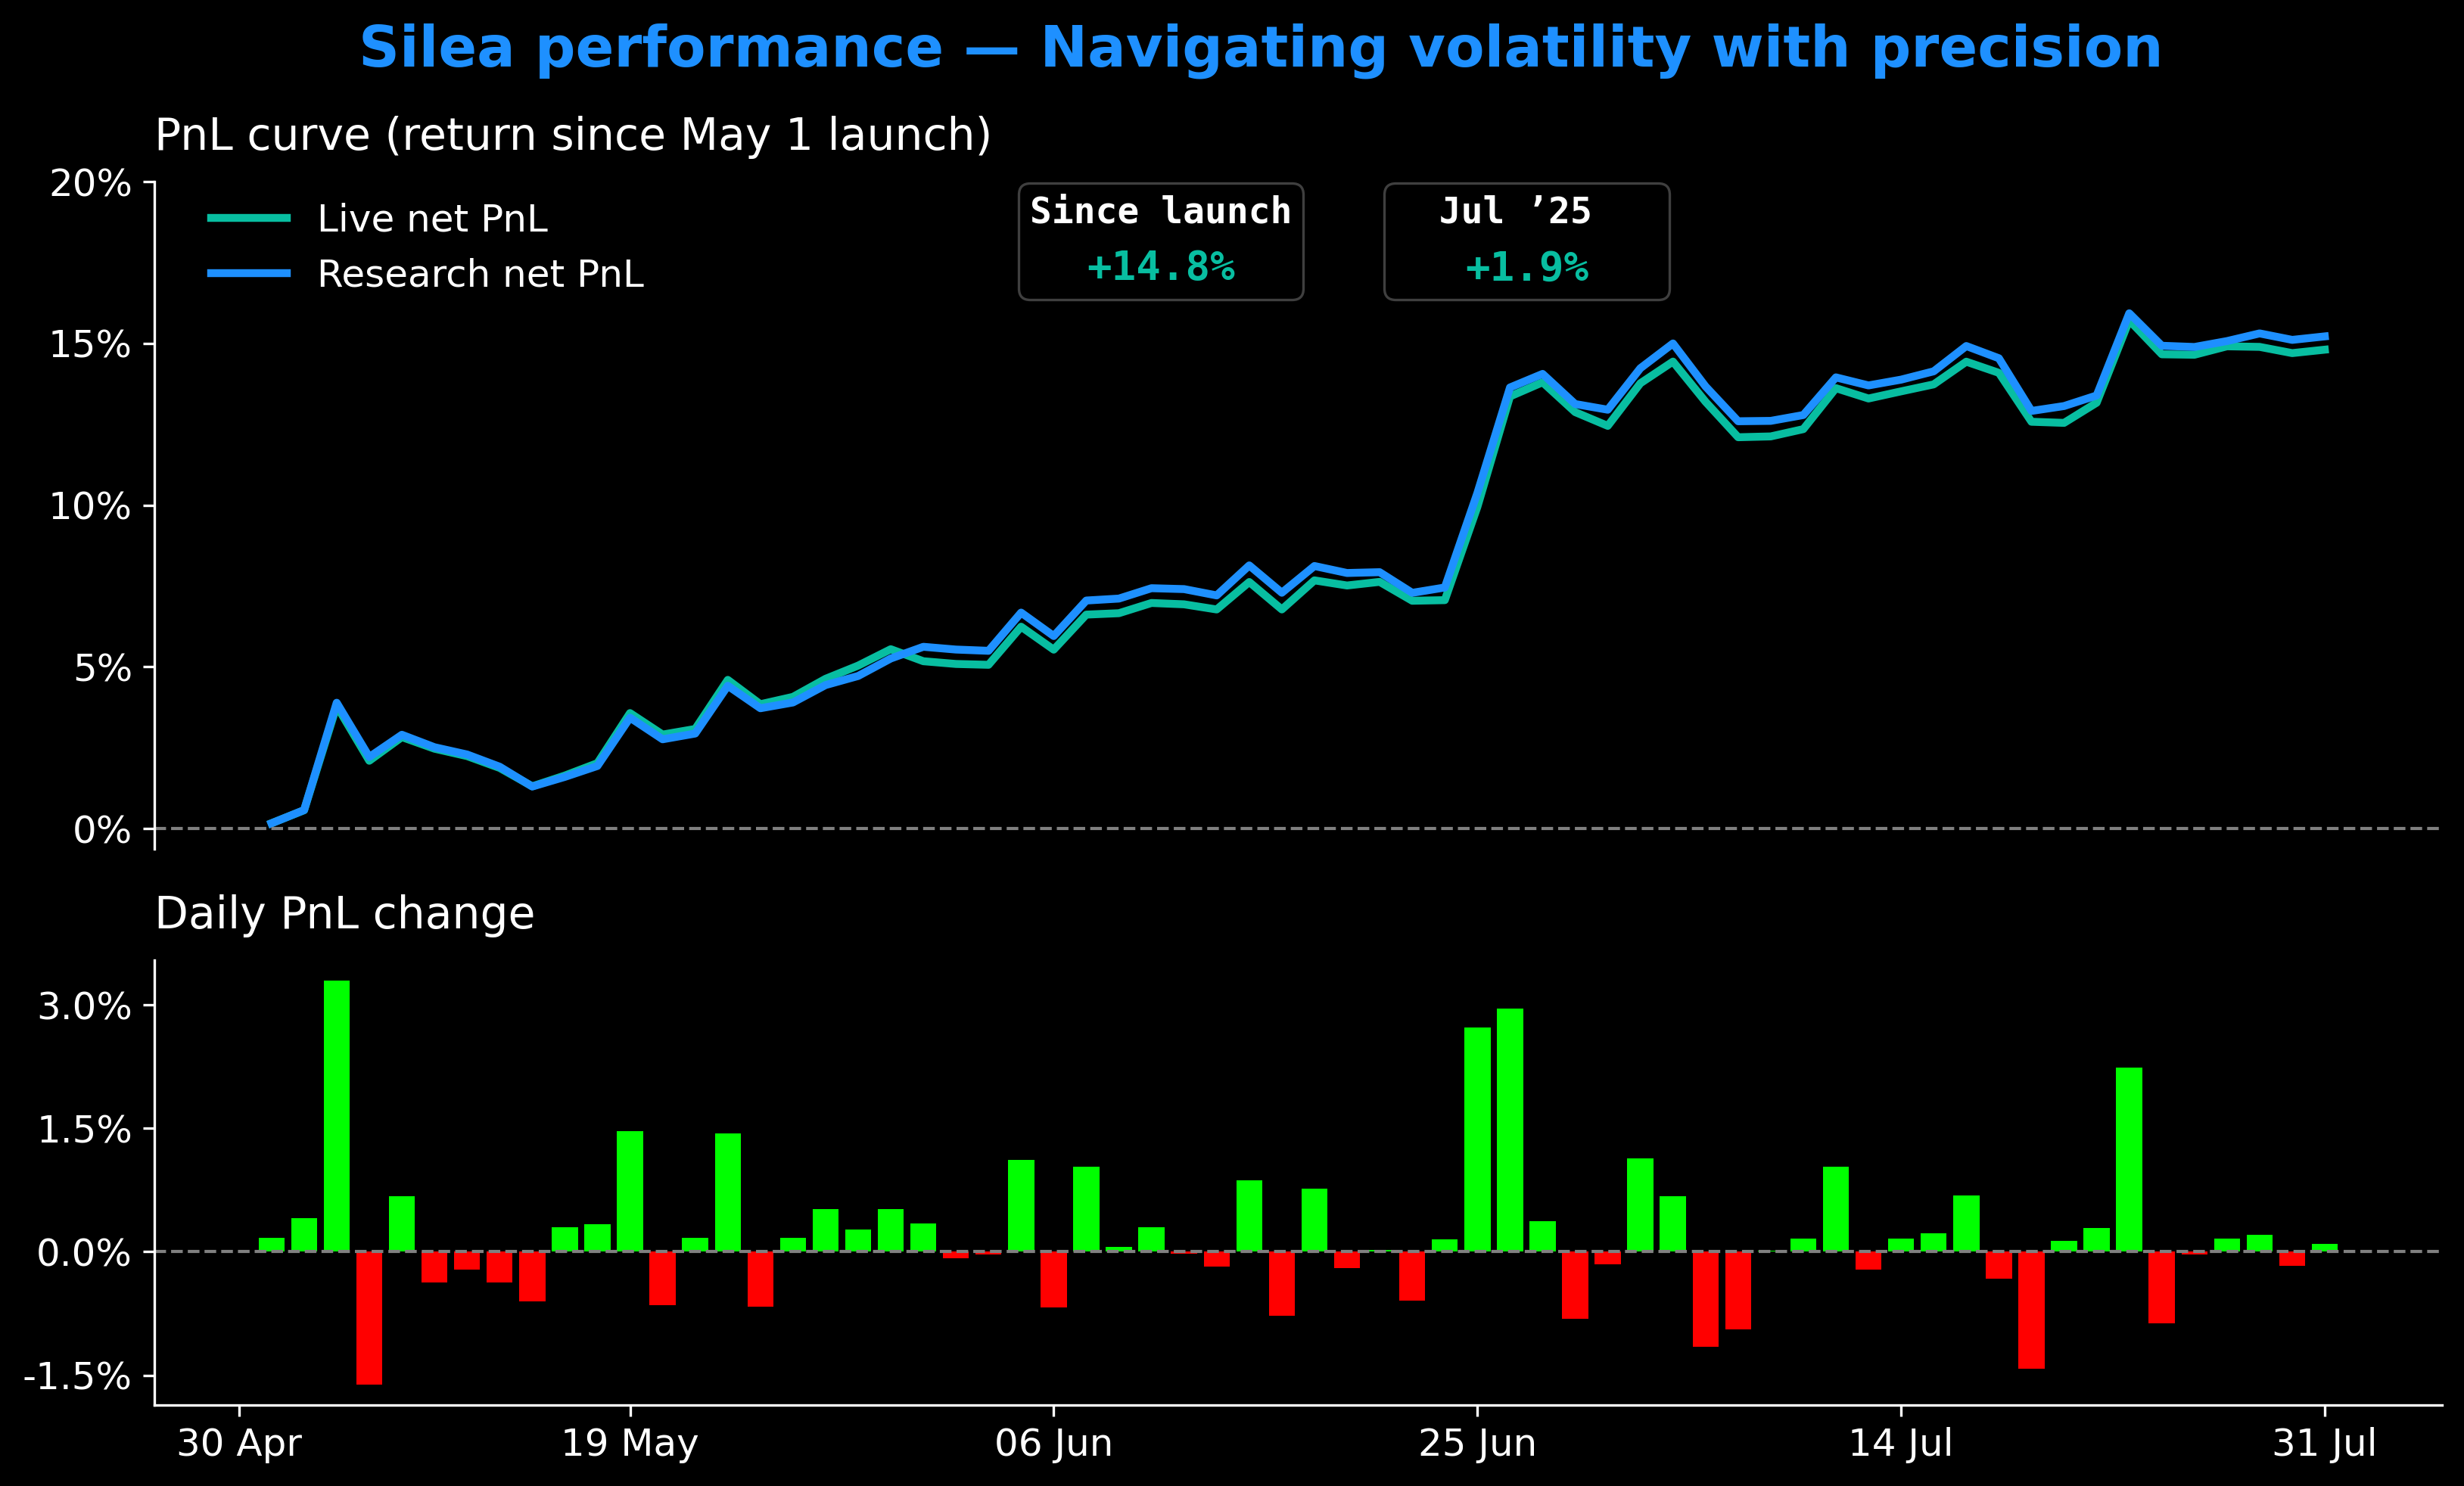
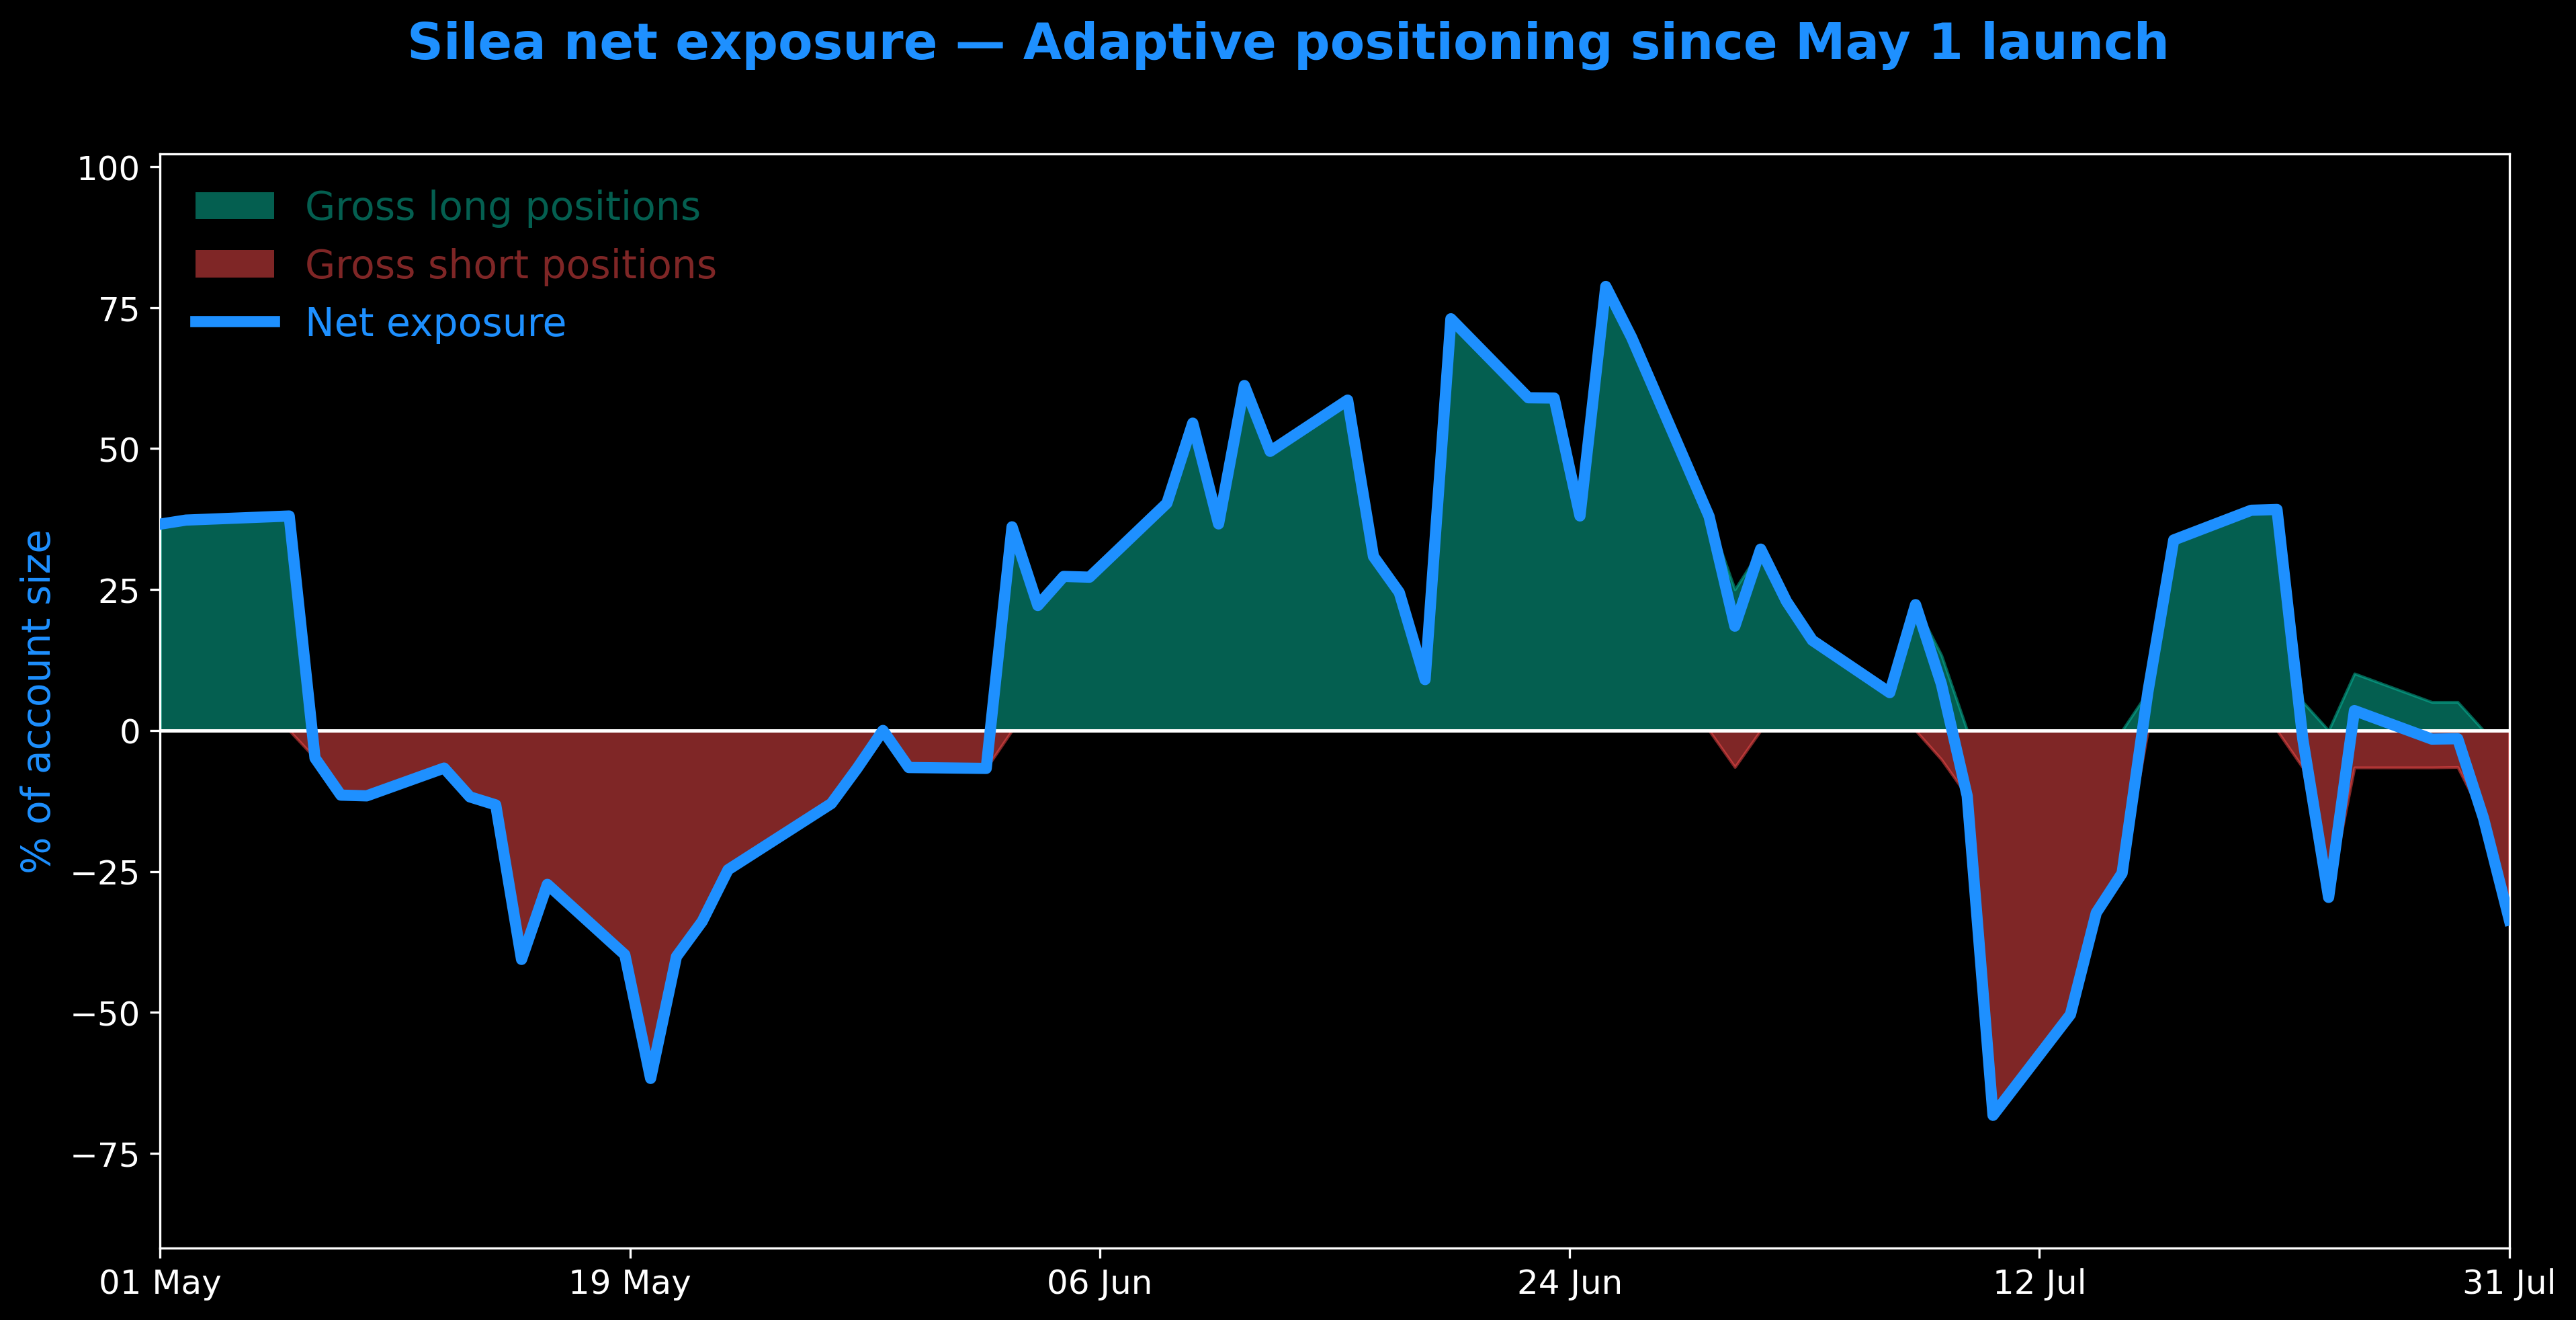
July was a more challenging environment with large market swings, yet Silea maintained its edge, generating a 1.9% gross return with low volatility. Our solution is built to profit whether markets are rising or falling. In July, Silea strategically shifted between net long positions (52% of trading days) and net short positions (48%), allowing us to profit from both market directions. This flexibility is what enables us to deliver superior returns regardless of market conditions.
Silea’s resilience is built on a highly diversified approach. We use 61 low-correlated signals built on top of 57 diversified data sources. These include price and volume data, physical premiums, warehouse stocks, and commodity shipments. We also track macro indicators, sentiment indices, and other asset classes like currencies, equities, and bonds. This breadth ensures our solution adapts in real-time while maintaining disciplined risk control. The chart below shows the aggregate portfolio return in July and a breakdown of performance by four key themes: Risk Sentiment, Industrial Demand, Fundamentals, and China Exposure.
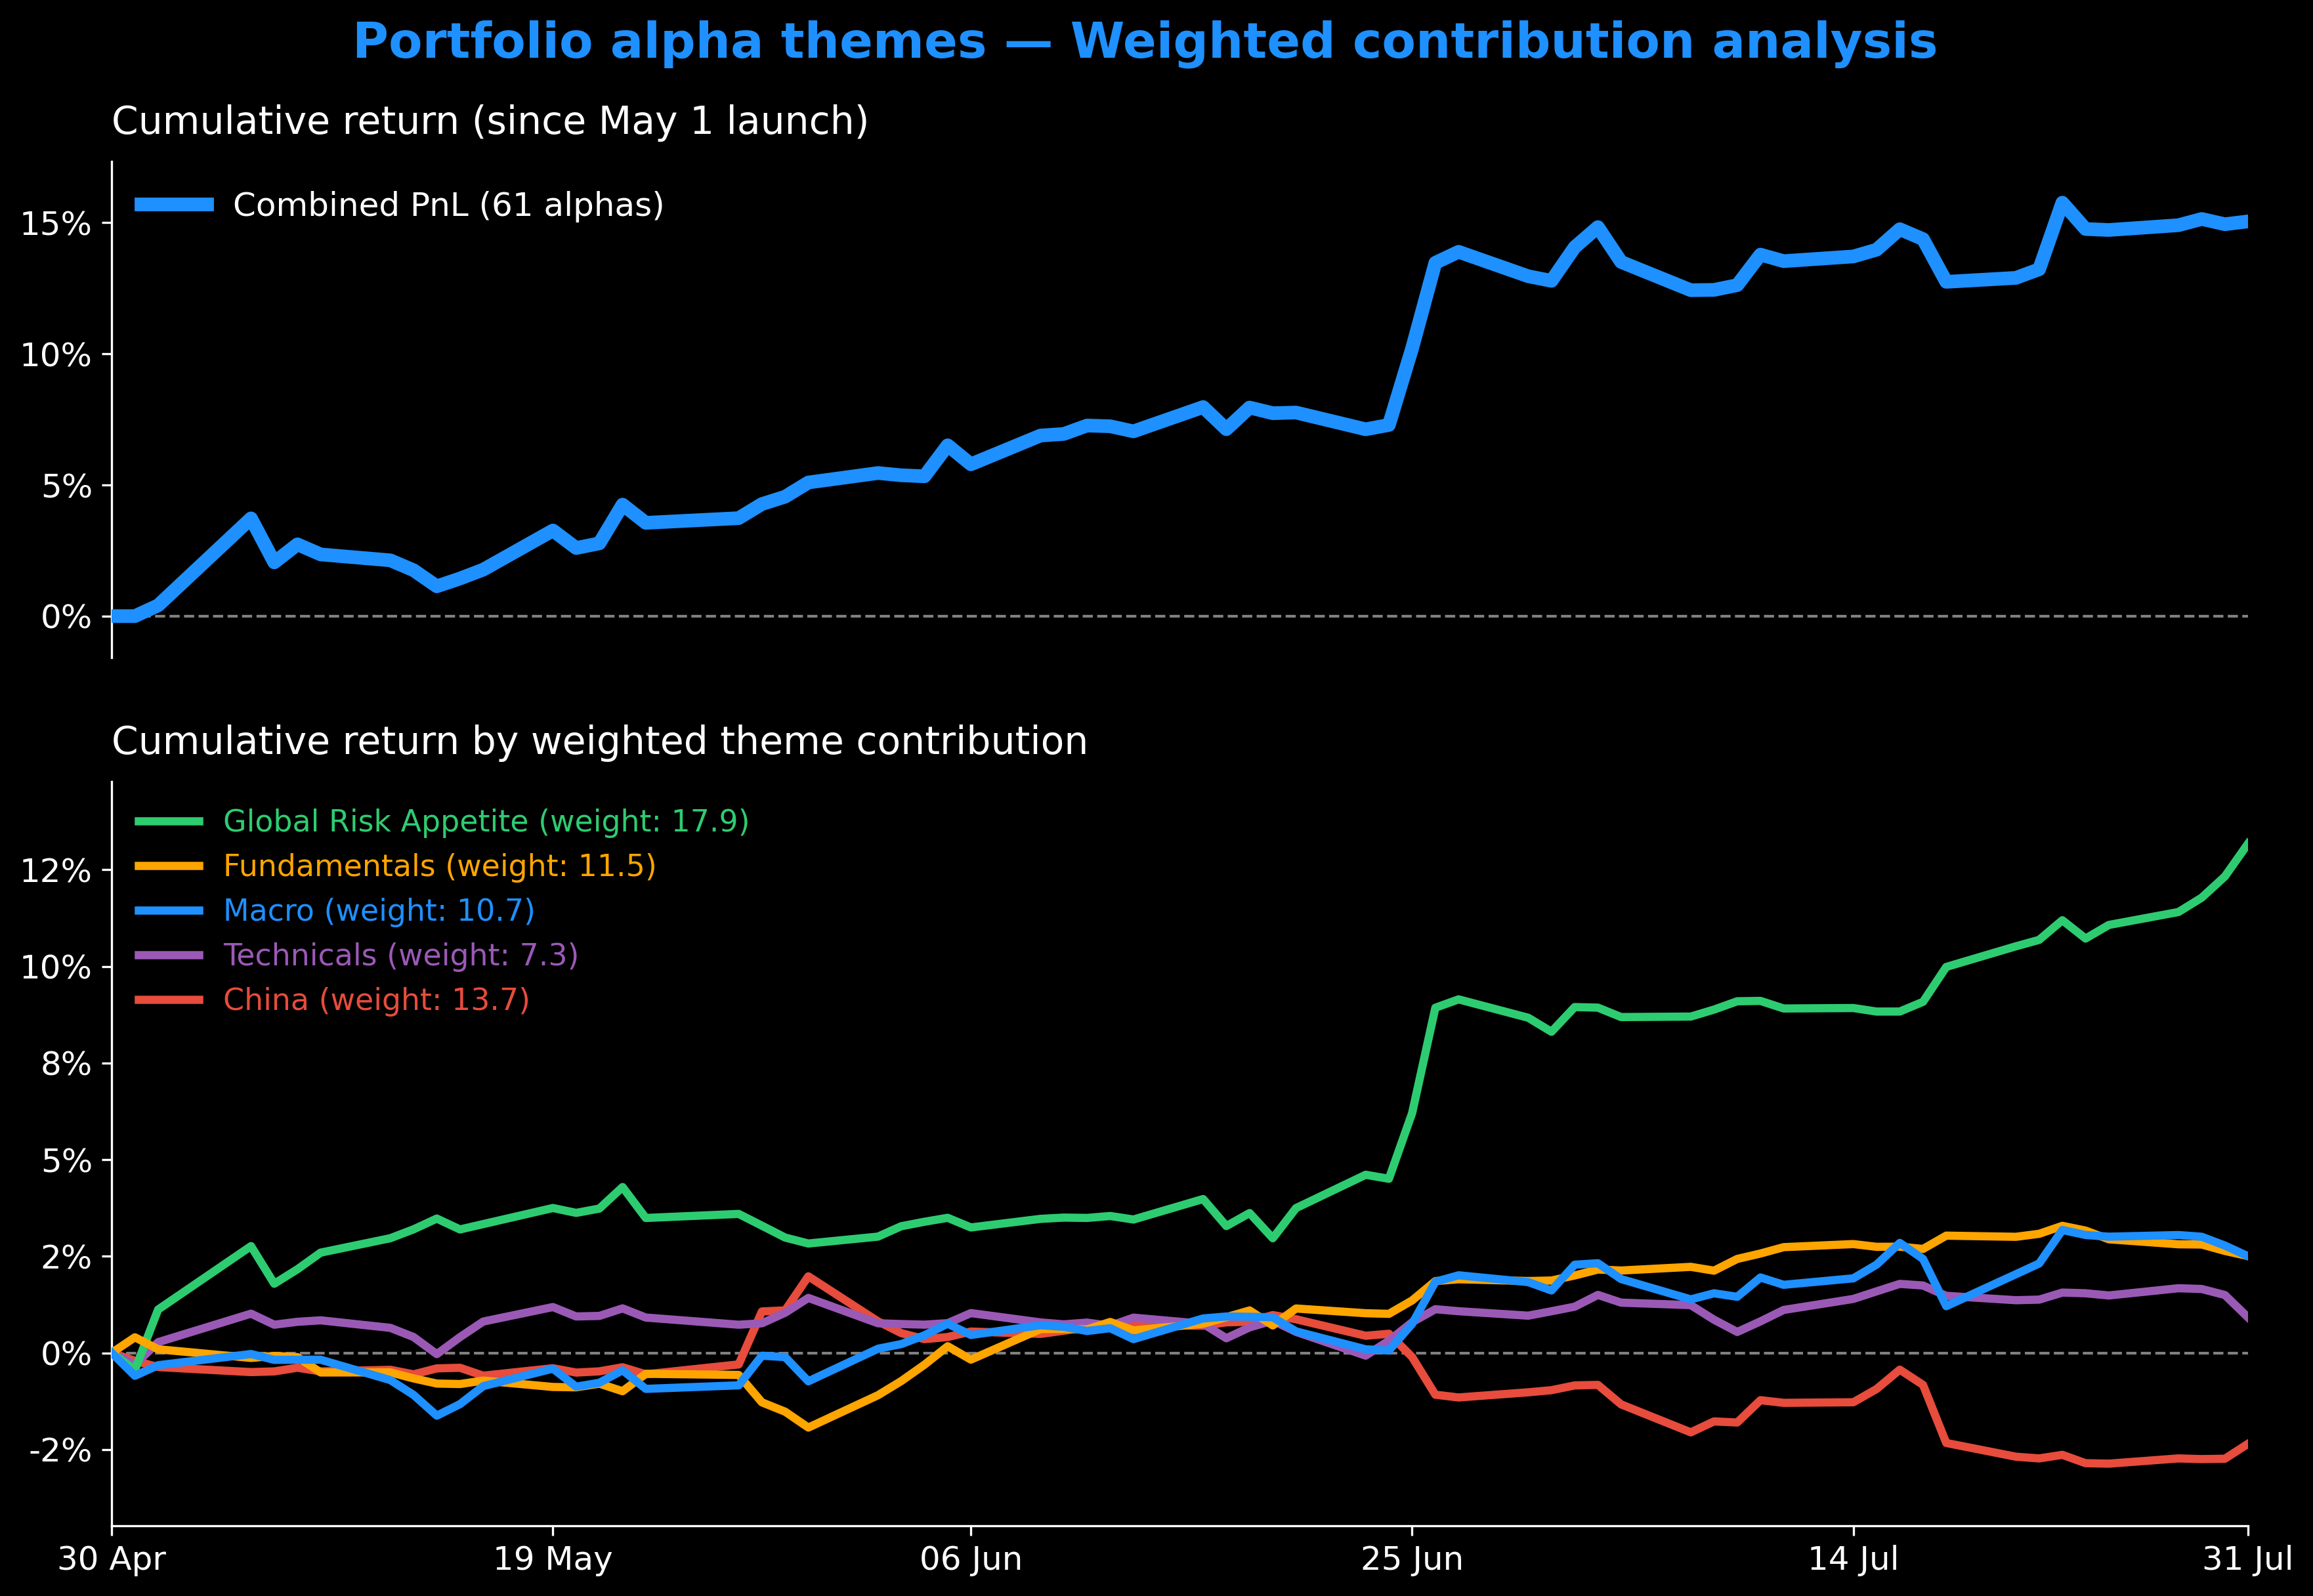
This is just one of many ways we classify our signals and their contribution to portfolio performance to ensure we are well-diversified and can deliver stable, risk-adjusted returns over time.
The result is a solution that doesn't just weather market volatility—it systematically extracts value from it.